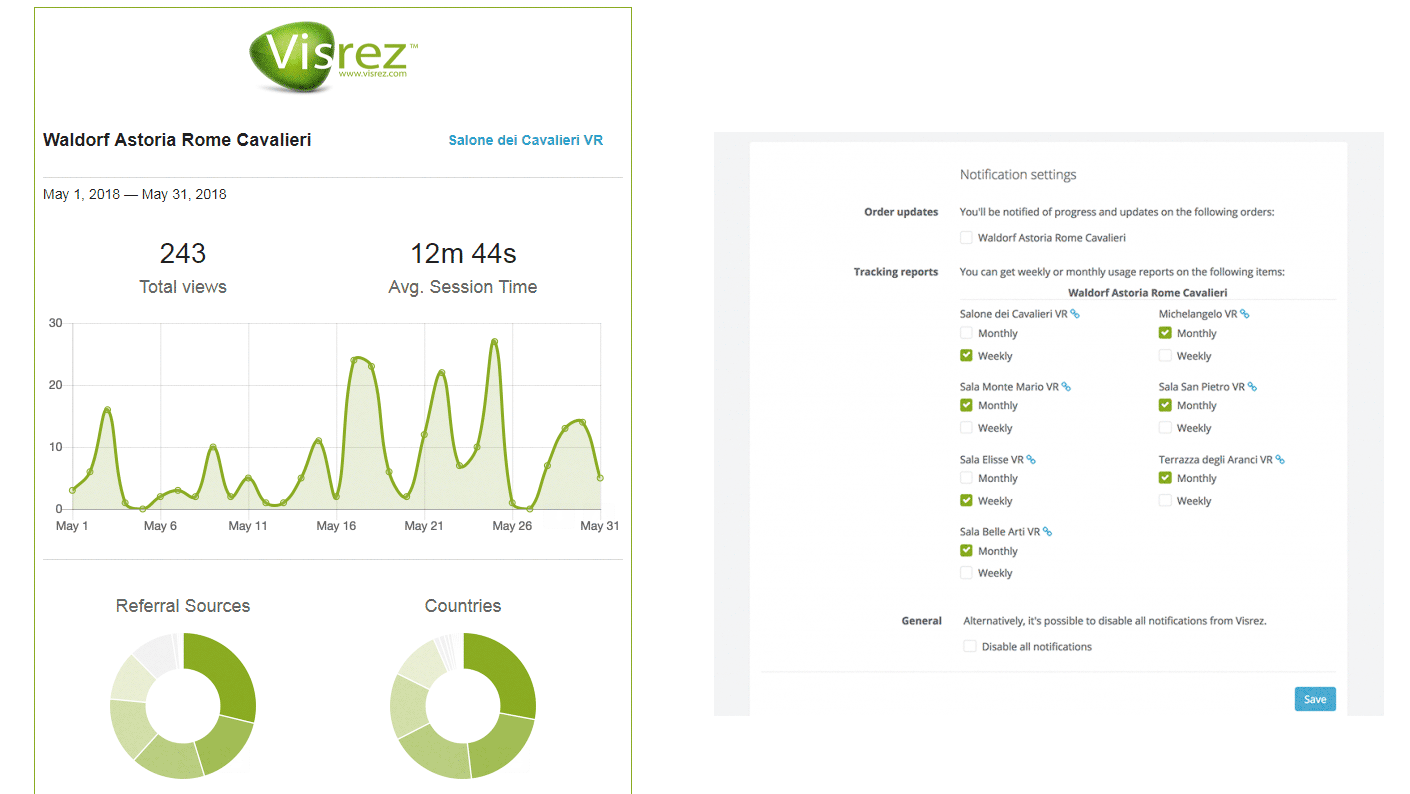
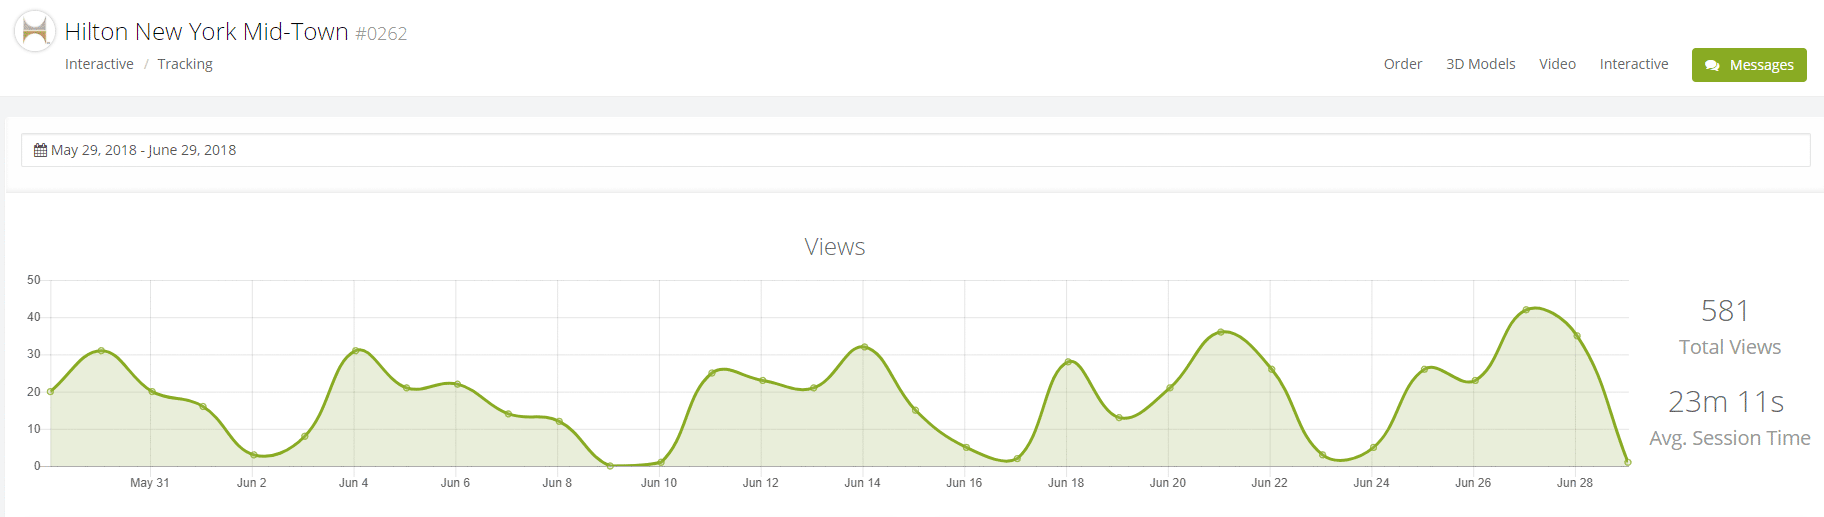
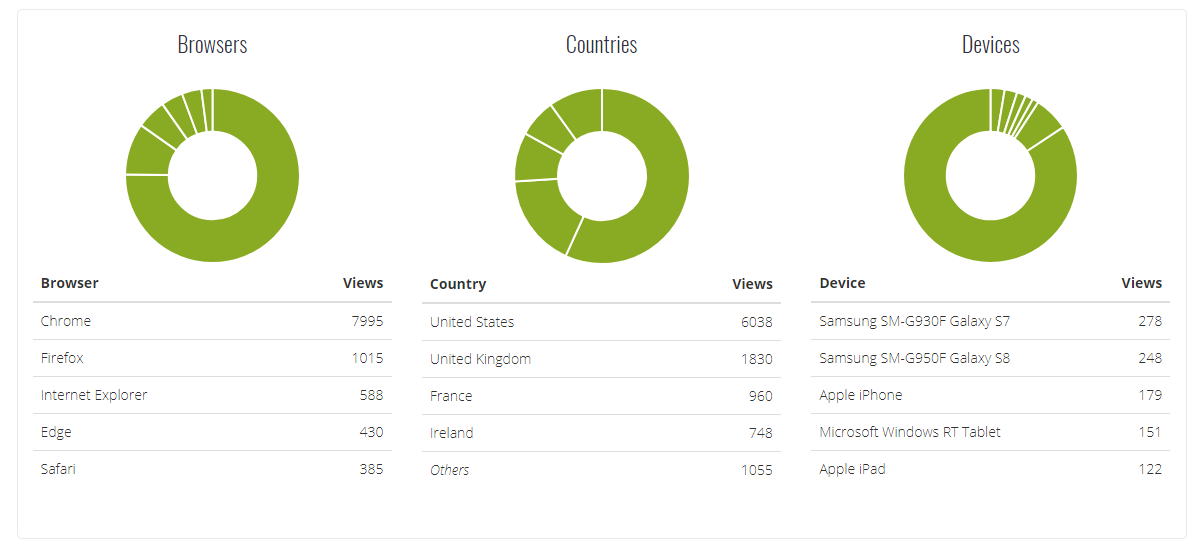
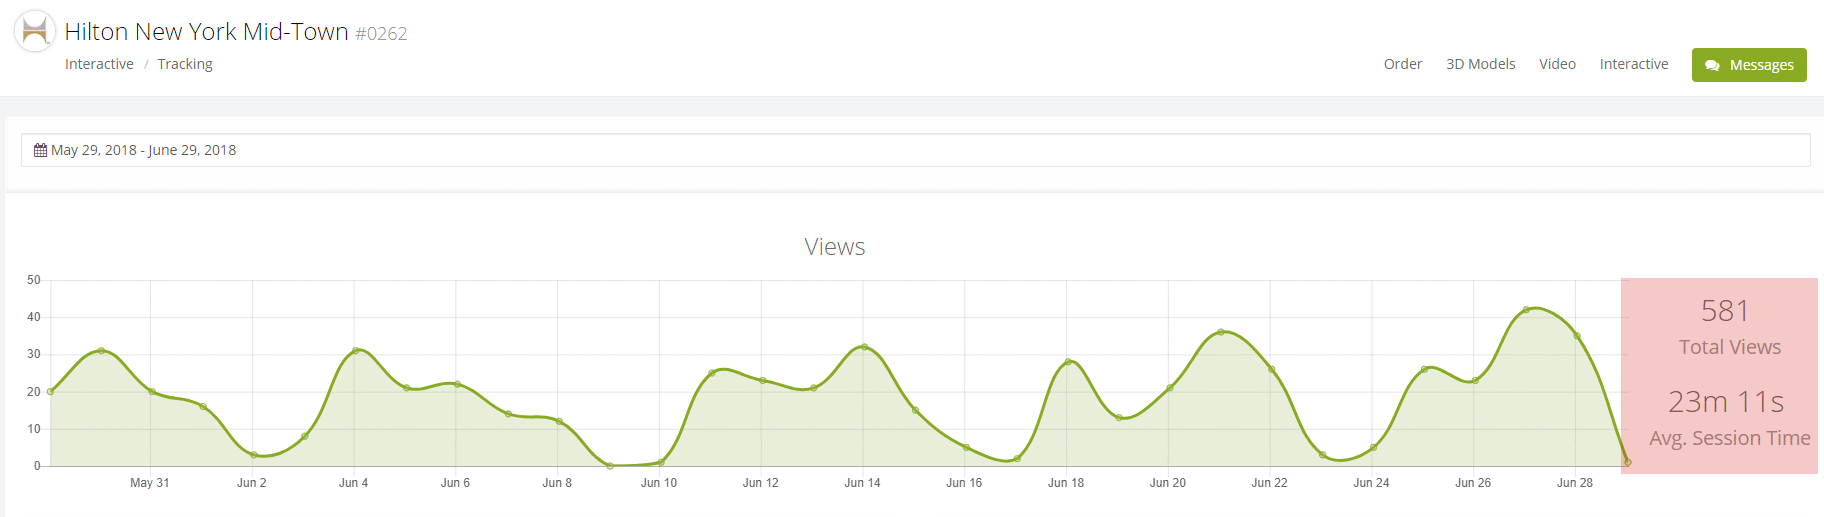
Tracking and reporting for Interactive Maps & VR were features we had planned to incorporate for a long time and are delighted to announce that as of July 2018 all VR and Interactive Maps have in-built reporting in Visrez. Clients had been telling us how valuable the Interactive Maps and VR Spaces were to their sales teams but one crucial thing was missing, analytics on how customers engaged with these tools. We have built in a Tracking button below each Interactive Map or VR App linking to a reports page with a breakdown of the user sessions, countries, devices and referral sources from the date of launch.
Prominent placement of the Interactive Map or VR will generate more sessions so it is important to ensure they are easy to find within your site. There is no point in producing high quality interactive content and not making it easy for potential customers to find in your site. Some client apps enjoy daily sessions of several hundred unique users for the Interactive Maps.
Average session time is the best indicator of the value of VR and Interactive maps to our clients. Session times for both VR and Interactive Maps range from two to above ten minutes which are multiple times greater than the average duration of a web-page session. Increased engagement helps the customer’s decision making process when researching an event space or venue.
We have added a preferences page to allow clients manage report settings across all VR spaces in their account. Reports are emailed at the start of each month and clients can update their preferences to receive reports weekly or opt out of receiving email reports for specific VR spaces. So if you just want to generate a report for your ballroom this can be done.